When I was originally shopping for a UPS, having a built-in display wasn’t even on my radar. However, after installing the Cyberpower CP2000EIPFCRM2U 1200 W, I quickly learned to appreciate it.
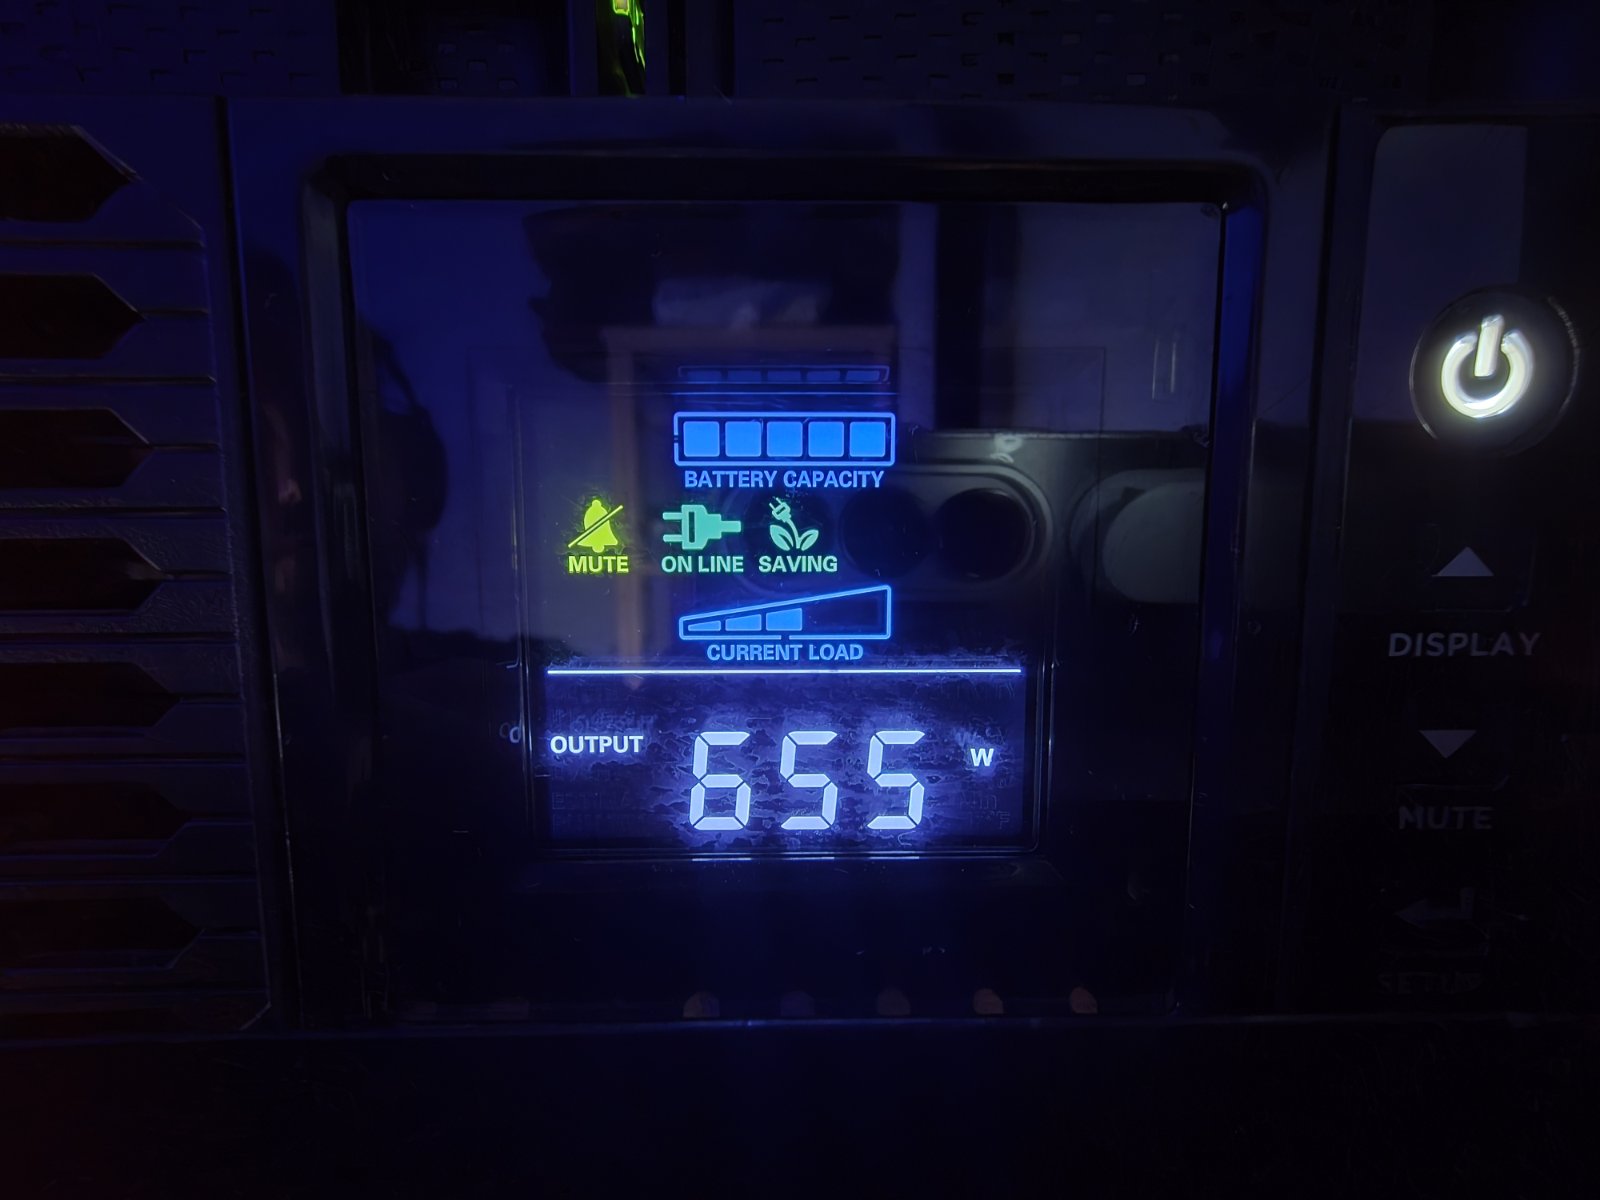
As you can see, I now have the live power consumption of the entire server rack constantly visible. It allows me to frequently—and often to my absolute horror—estimate just how massive my next electricity bill is going to be.
But this constant visibility sparked an idea. Since I am already glancing at the power draw multiple times a day, wouldn’t it be great to see the overall health of my IT infrastructure right next to it? Every system administrator knows we should be monitoring our environments proactively, but let’s be honest: we often get lazy. We don’t want to log into Zabbix every single time just to check if everything is green, which can sometimes lead to missing small issues before they become major outages.
In my professional work, there is always a large NOC (Network Operations Center) screen hanging on a wall somewhere displaying Zabbix. Whether you want to or not, you passively absorb the status of the systems. I wanted that exact same experience for my homelab, but in a subtle, non-intrusive form factor.
The Hardware: Waveshare 7″ HDMI LCD
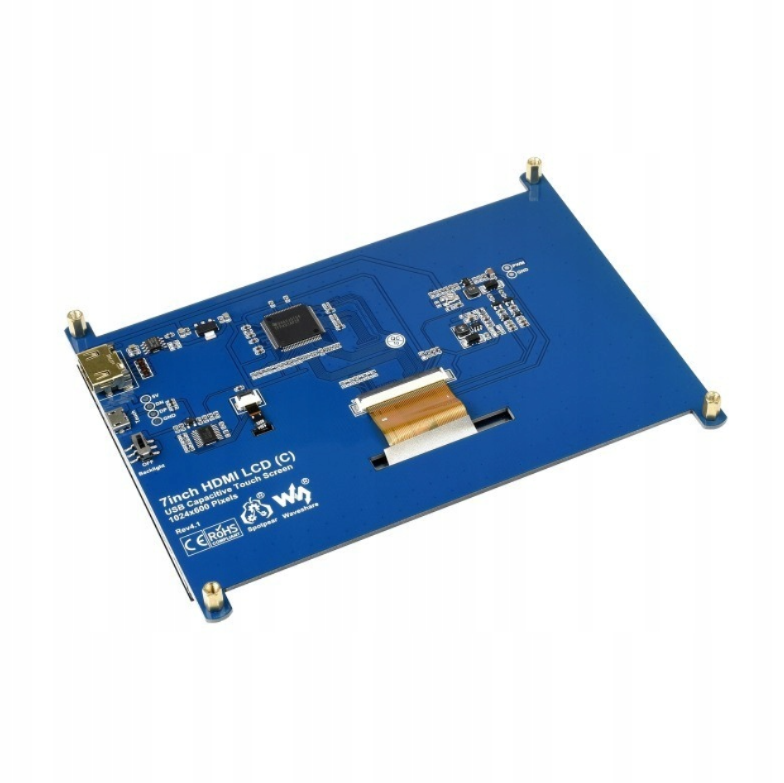
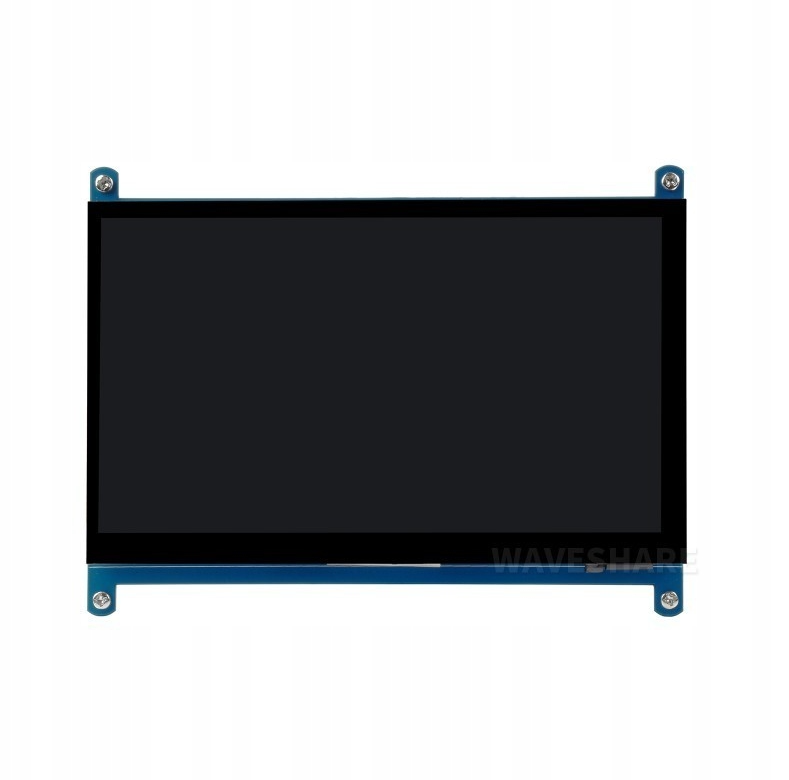
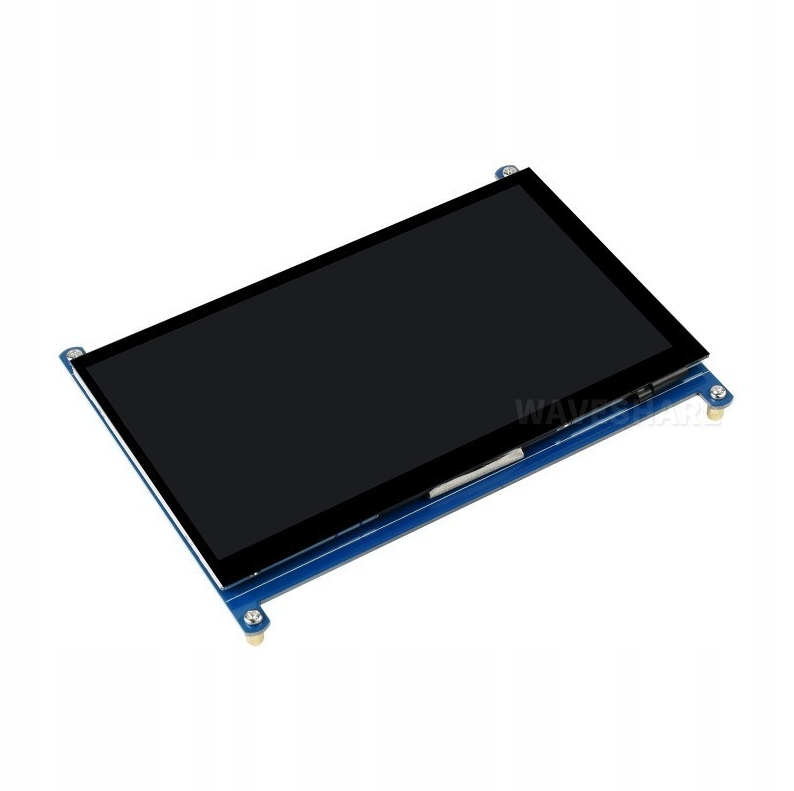
After digging through the internet, I found the perfect candidate: the Waveshare LCD 7″ (C) 1024×600 HDMI touch display.
Here is what the display looks like from the front and the exposed PCB on the back:
Technical Specifications:
-
-
Diagonal: 7″
-
Resolution: 1024×600 px
-
Matrix Type: LCD IPS (Excellent for rack mounting due to the 170° viewing angle)
-
Video Interface: HDMI
-
Touch: 5-point capacitive touch (USB interface)
-
Protection: Tempered glass panel
-
Dimensions: 164.9 x 124.27 mm
-
Weight: 395 g
-
The kit is generous, including the display itself, an HDMI cable, HDMI to microHDMI adapters, a USB A to micro B cable, and mounting standoffs.
Rack Mounting & The Connectivity Dilemma
Without overthinking it, I bought the little screen and decided to mount it directly onto the glass door of my server rack.
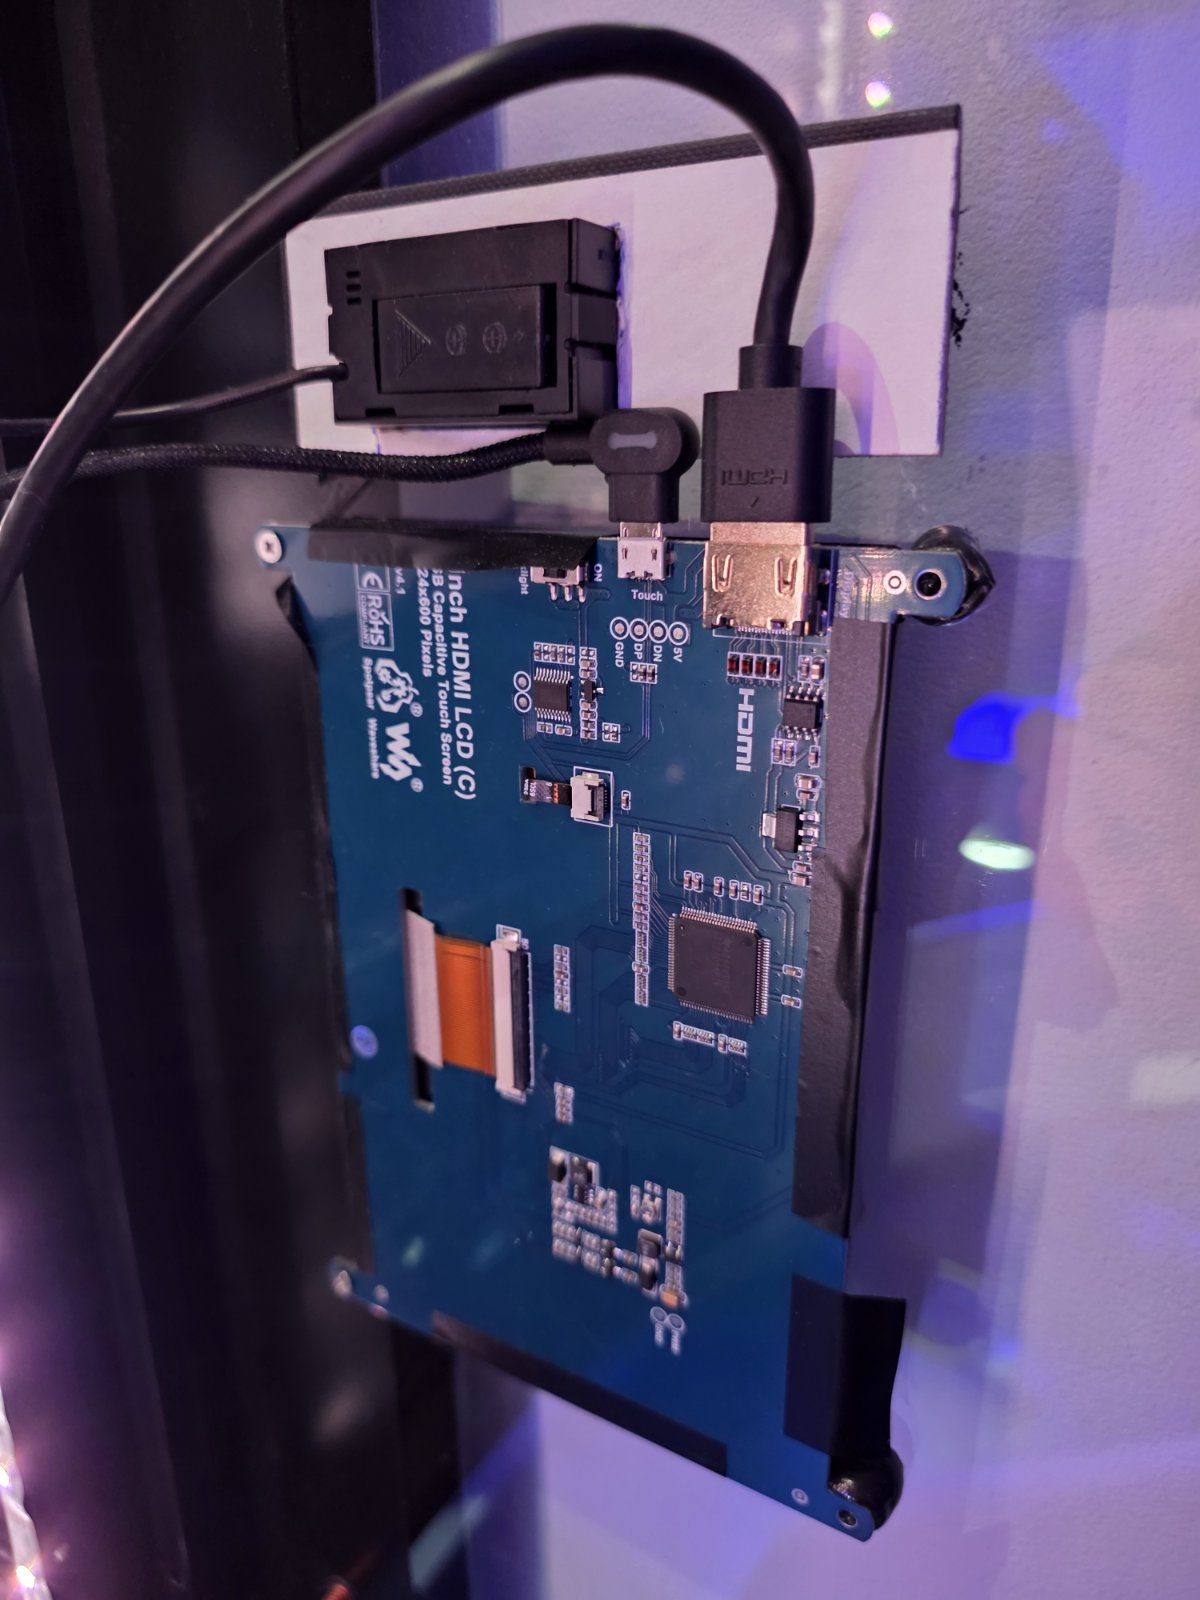
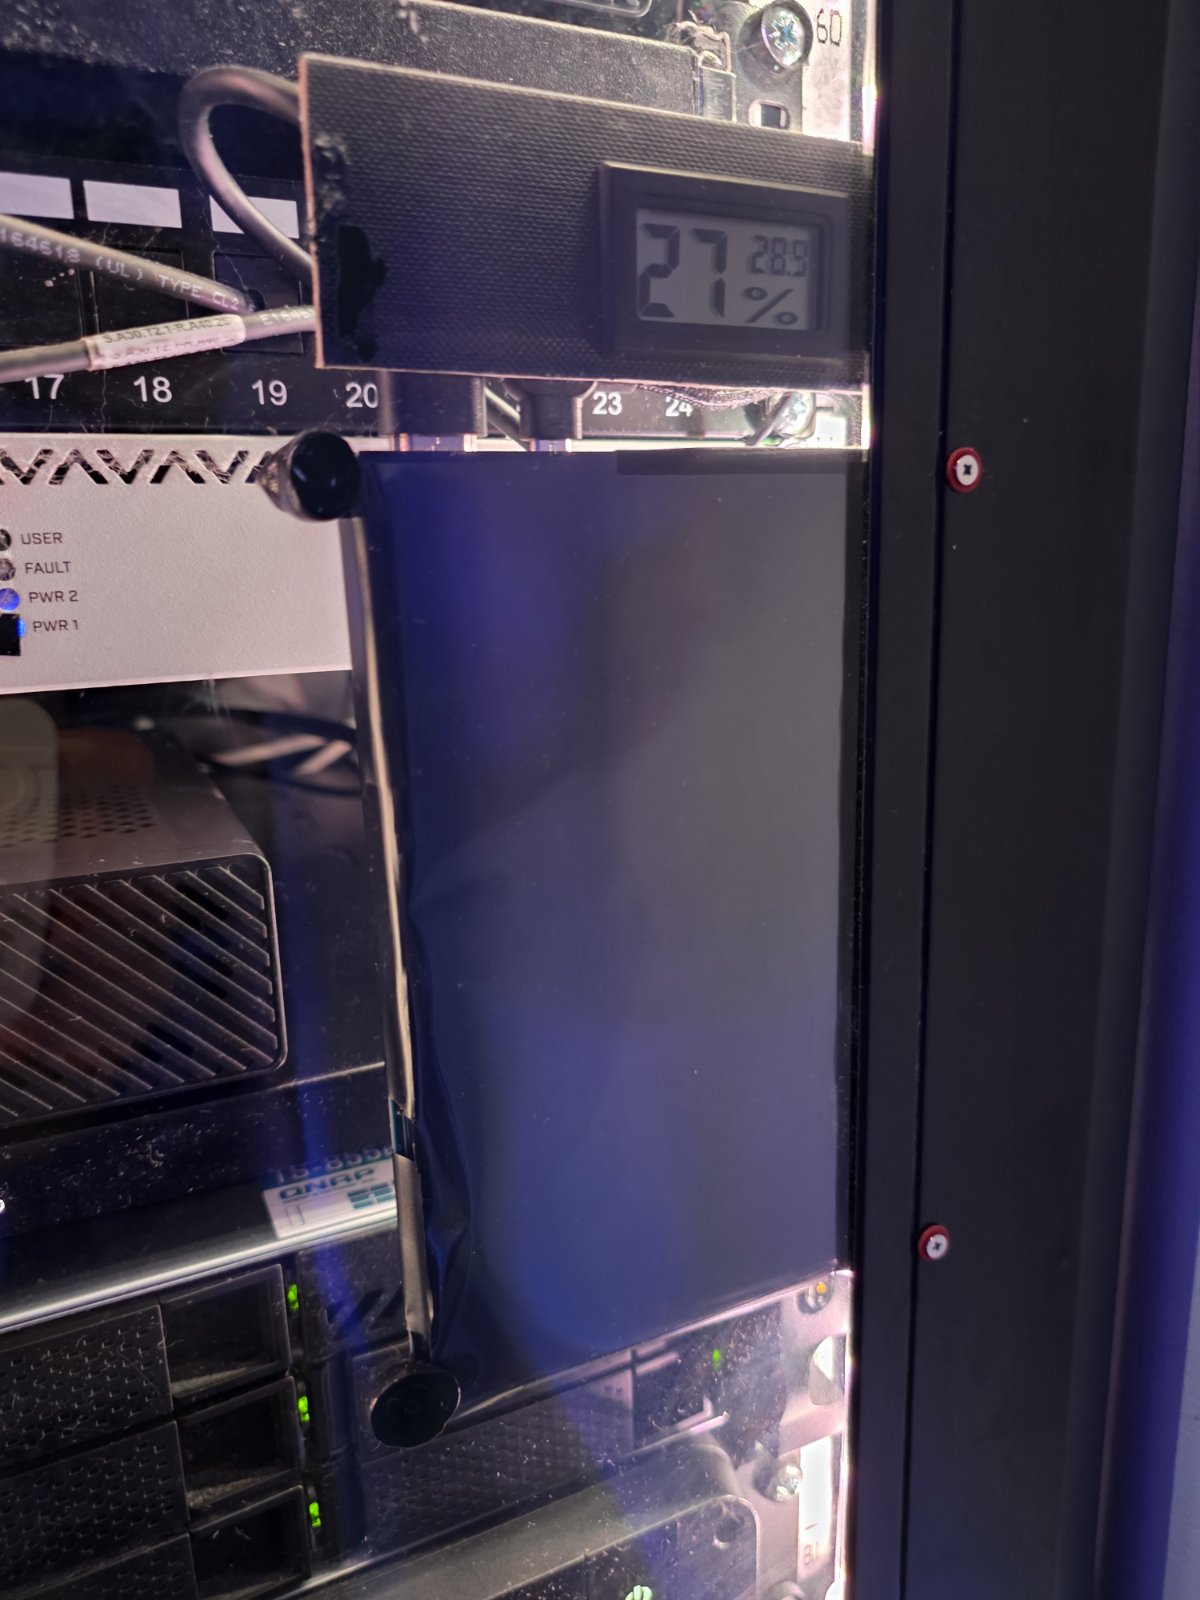
I drilled mounting holes straight through the rack’s front door and secured the screen using two screws. To maximize the utility of this little monitoring station, I also added a digital thermometer/hygrometer right above the screen, routing its temperature probe to the very top of the rack to monitor exhaust heat. You can see the rear wiring of the display pressed against the glass.
How do you drive a display in a server rack? My initial thought was to connect the HDMI and USB cables to one of my VMware nodes and assign the display to a dedicated VM. However, any sysadmin who has attempted this knows it’s a nightmare. Passing a physical GPU/HDMI output from an ESXi hypervisor directly to a guest OS is highly problematic. It often requires dedicated hardware, causes driver conflicts, and defeats the abstraction purpose of a hypervisor. It was simply too much unnecessary complexity.
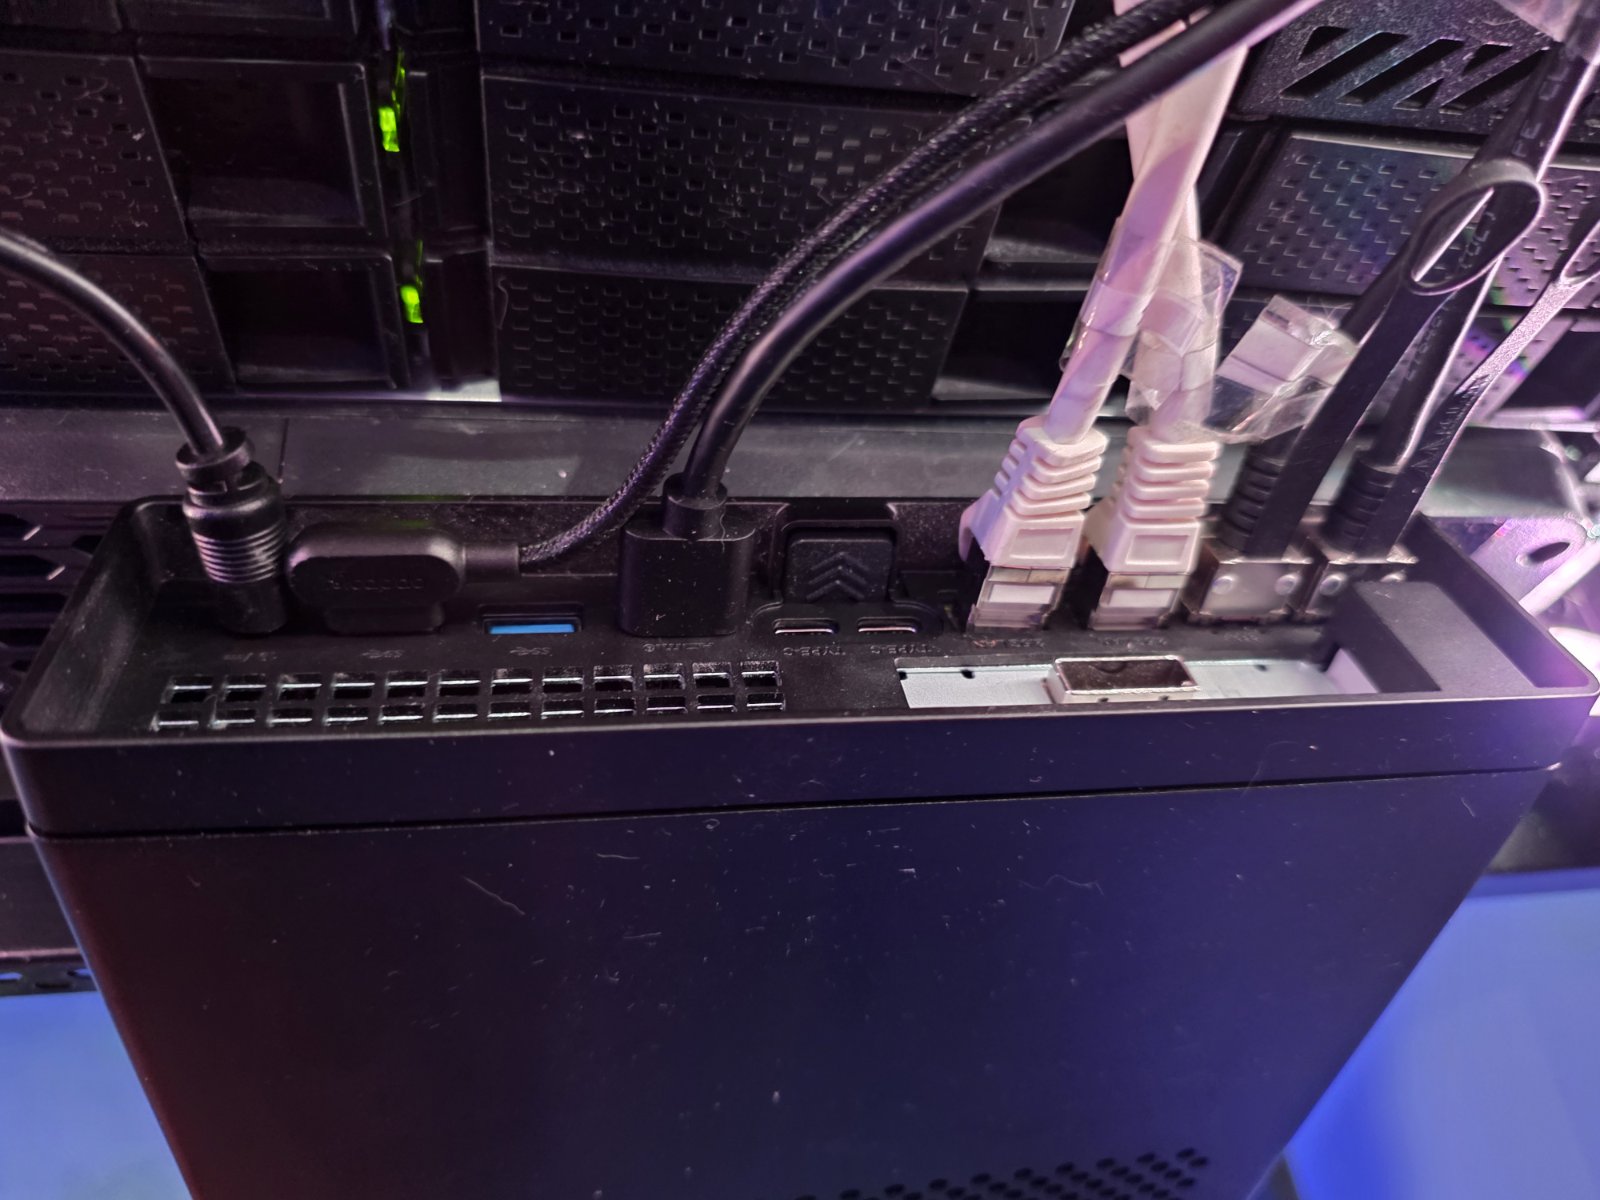
Thankfully, alongside my VMware cluster, I have a dedicated bare-metal backup server—my beloved Minisforum MS-A2.
As shown in the picture, the rear I/O of the Minisforum was perfect for this. The Waveshare display requires an HDMI connection for video and a USB-C connection for power (and touch data). Even though I didn’t strictly need the touch functionality, plugging both directly into the backup PC was by far the path of least resistance.
Booting Up & OS Configuration
The moment of truth—powering on the server.
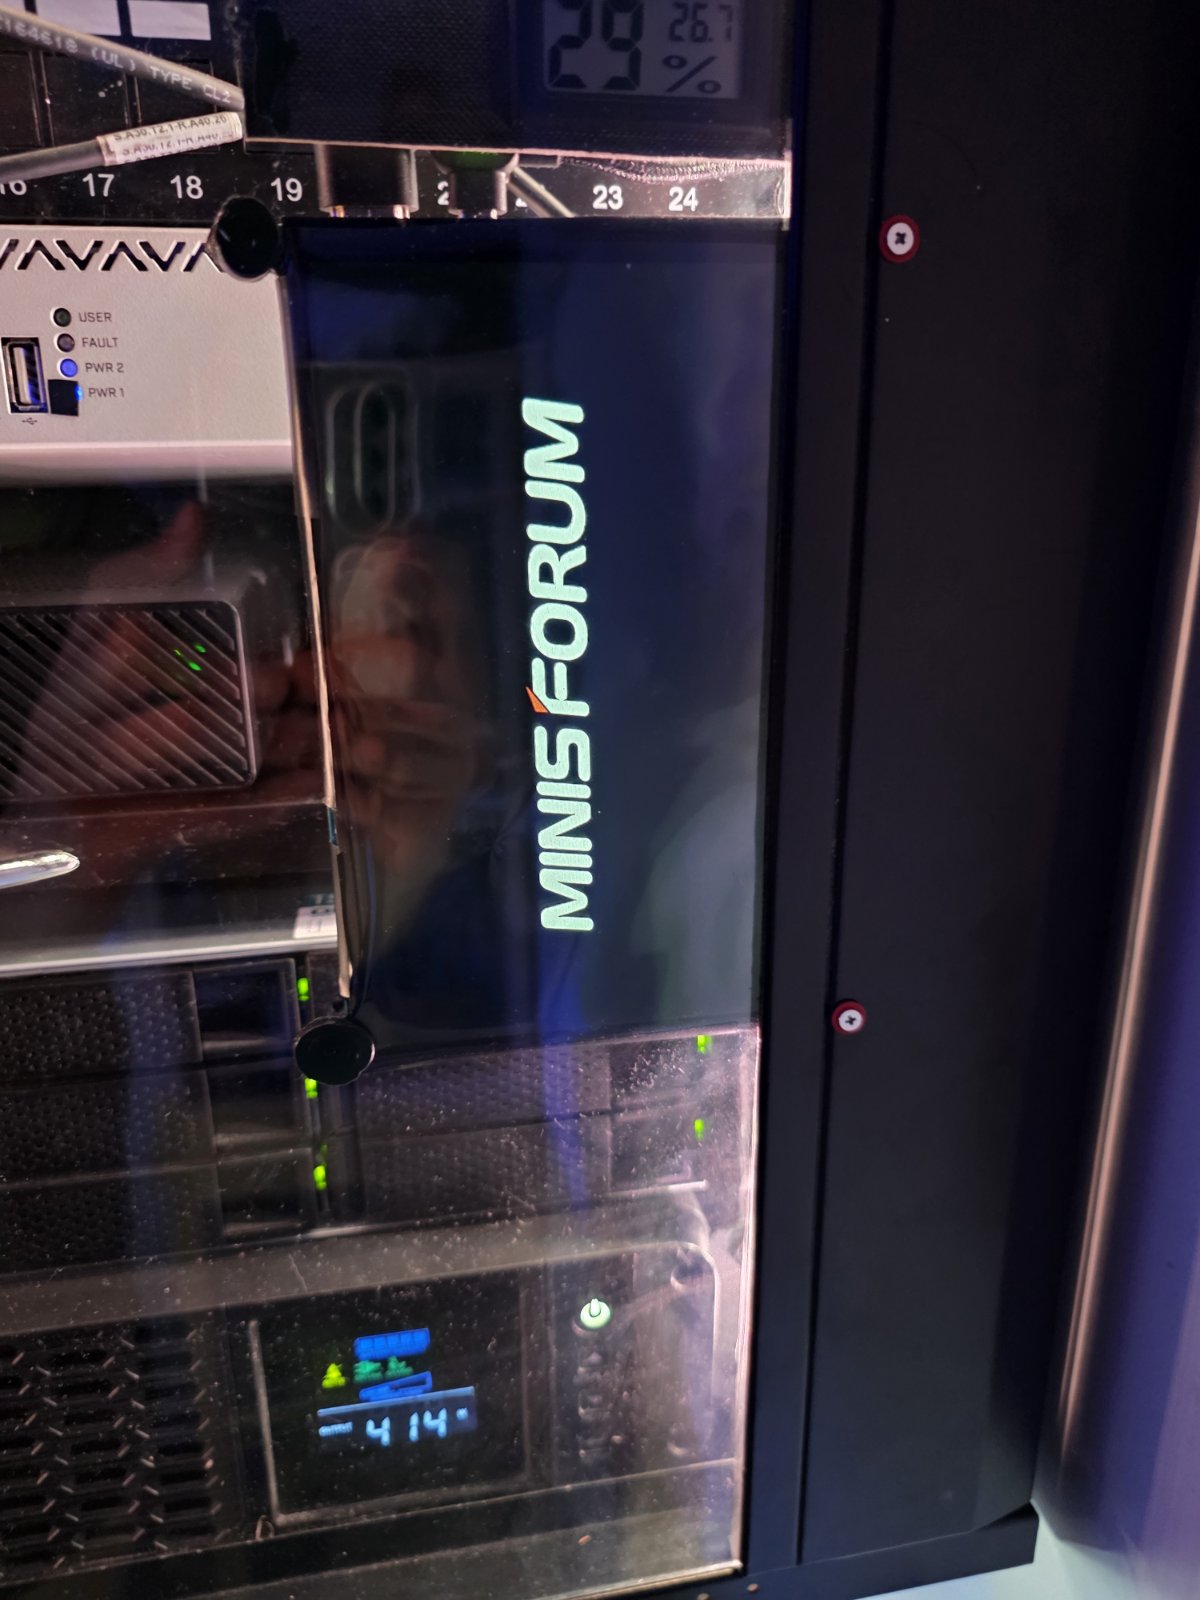
Seeing the Minisforum boot logo illuminate the little screen was a great success. The display powered on flawlessly using just the USB connection from the mini PC.
Because I mounted the screen vertically on the rack door, the default orientation was sideways. I quickly jumped into the Windows Server display settings and rotated the output by 90 degrees. Within moments, I was greeted by a perfectly oriented Windows Server lock screen and desktop environment.
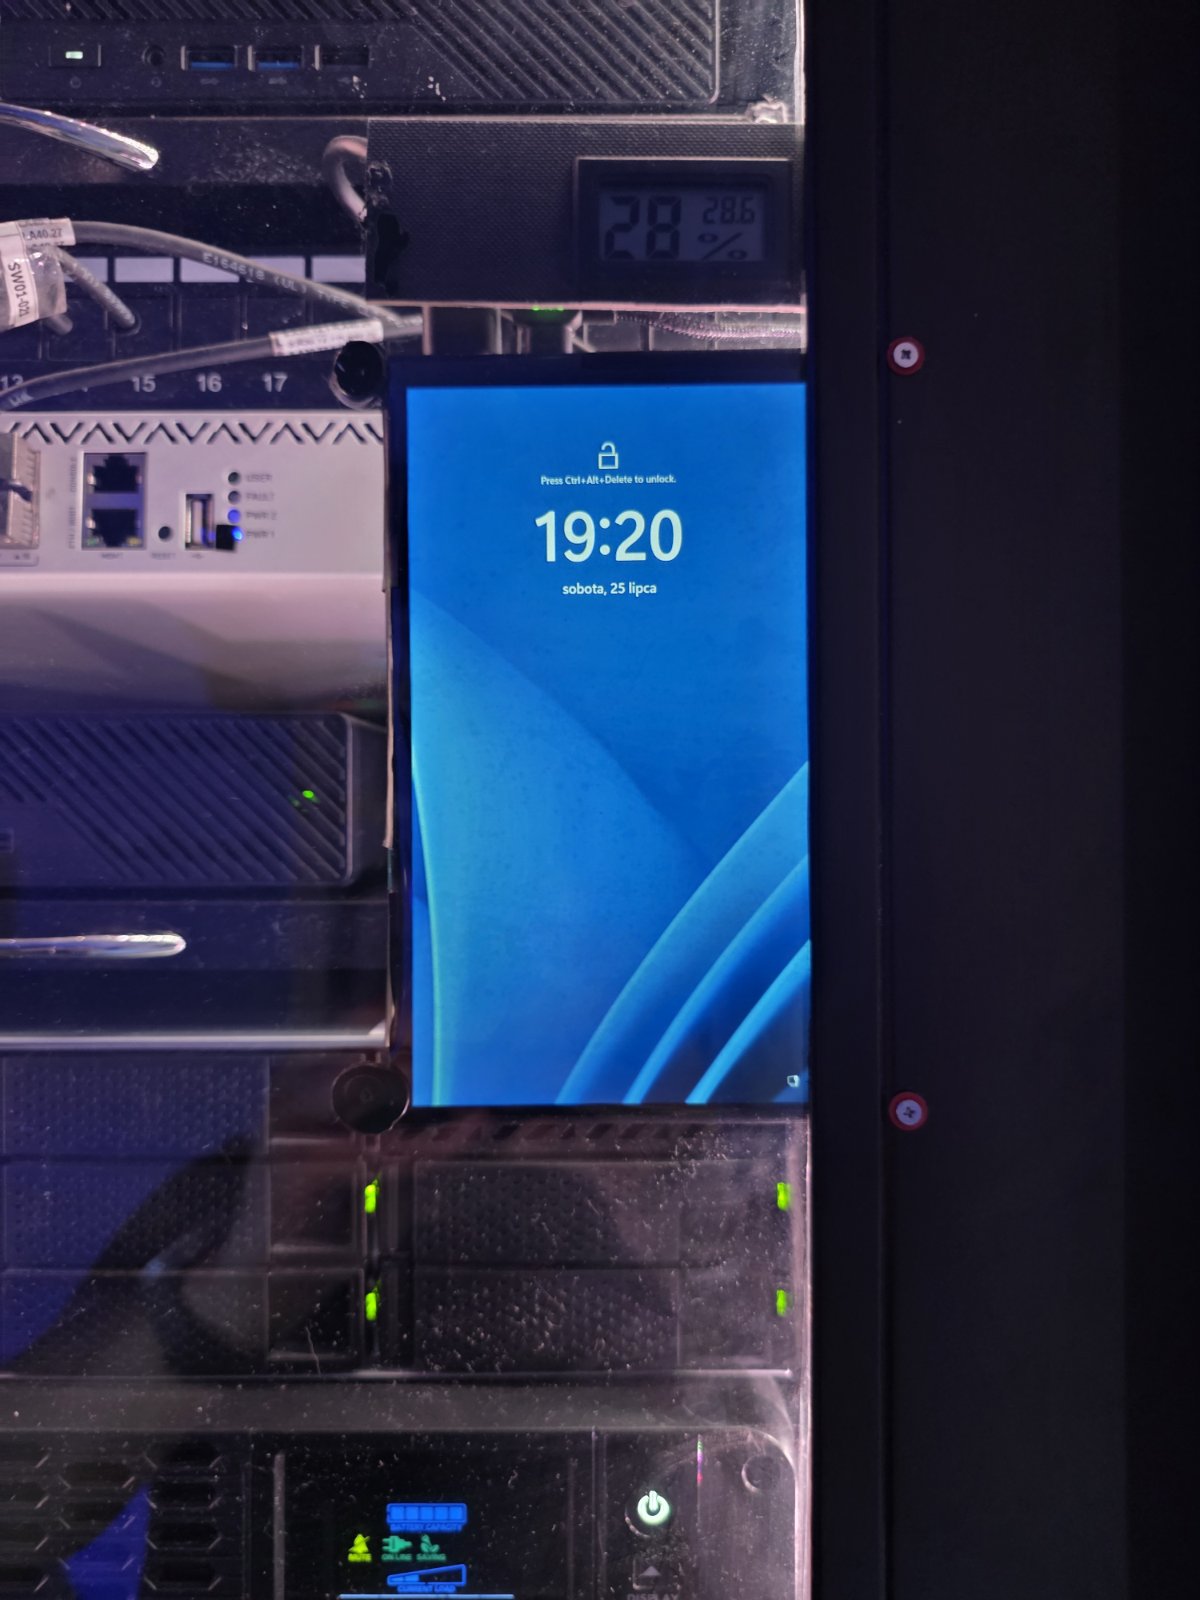
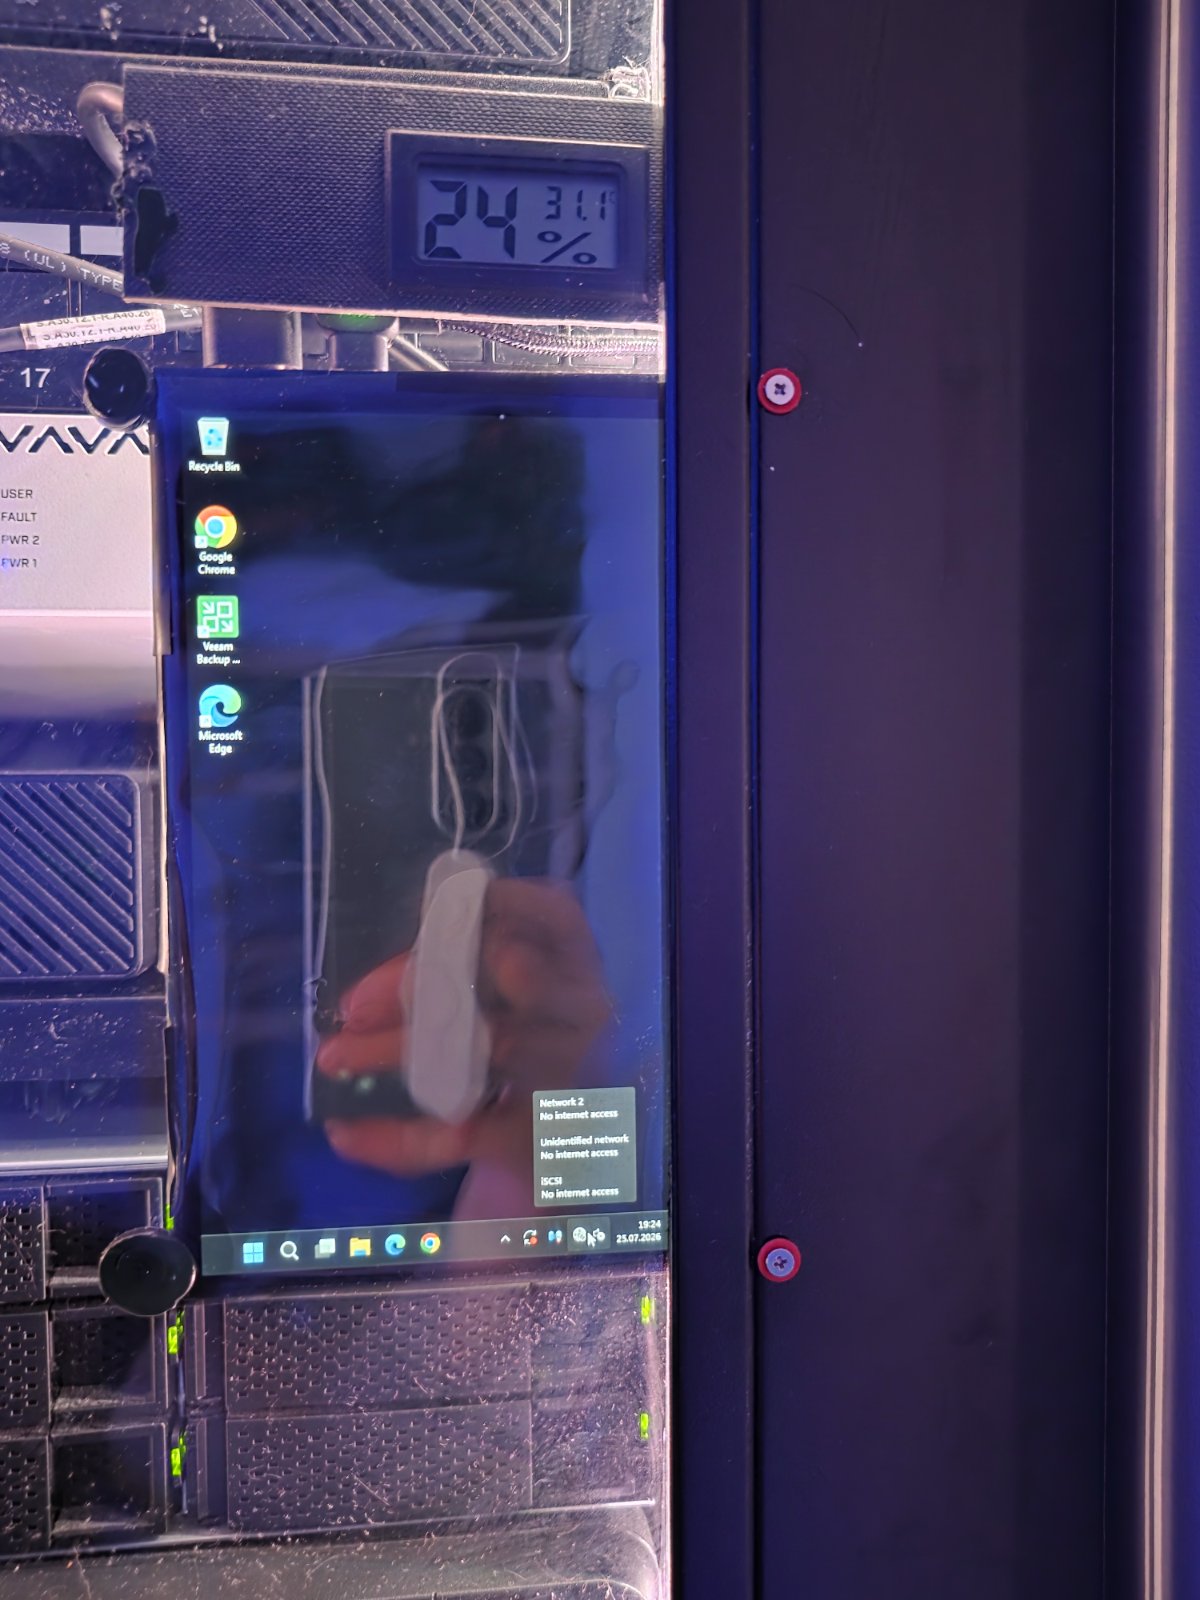
Security & Dashboard Tweaking: Since this machine is my backup server, security is paramount. I created a heavily restricted, unprivileged local „Guest” account. This account has one purpose and one purpose only: to automatically log in and launch a web browser in full-screen mode pointing to my Zabbix server.
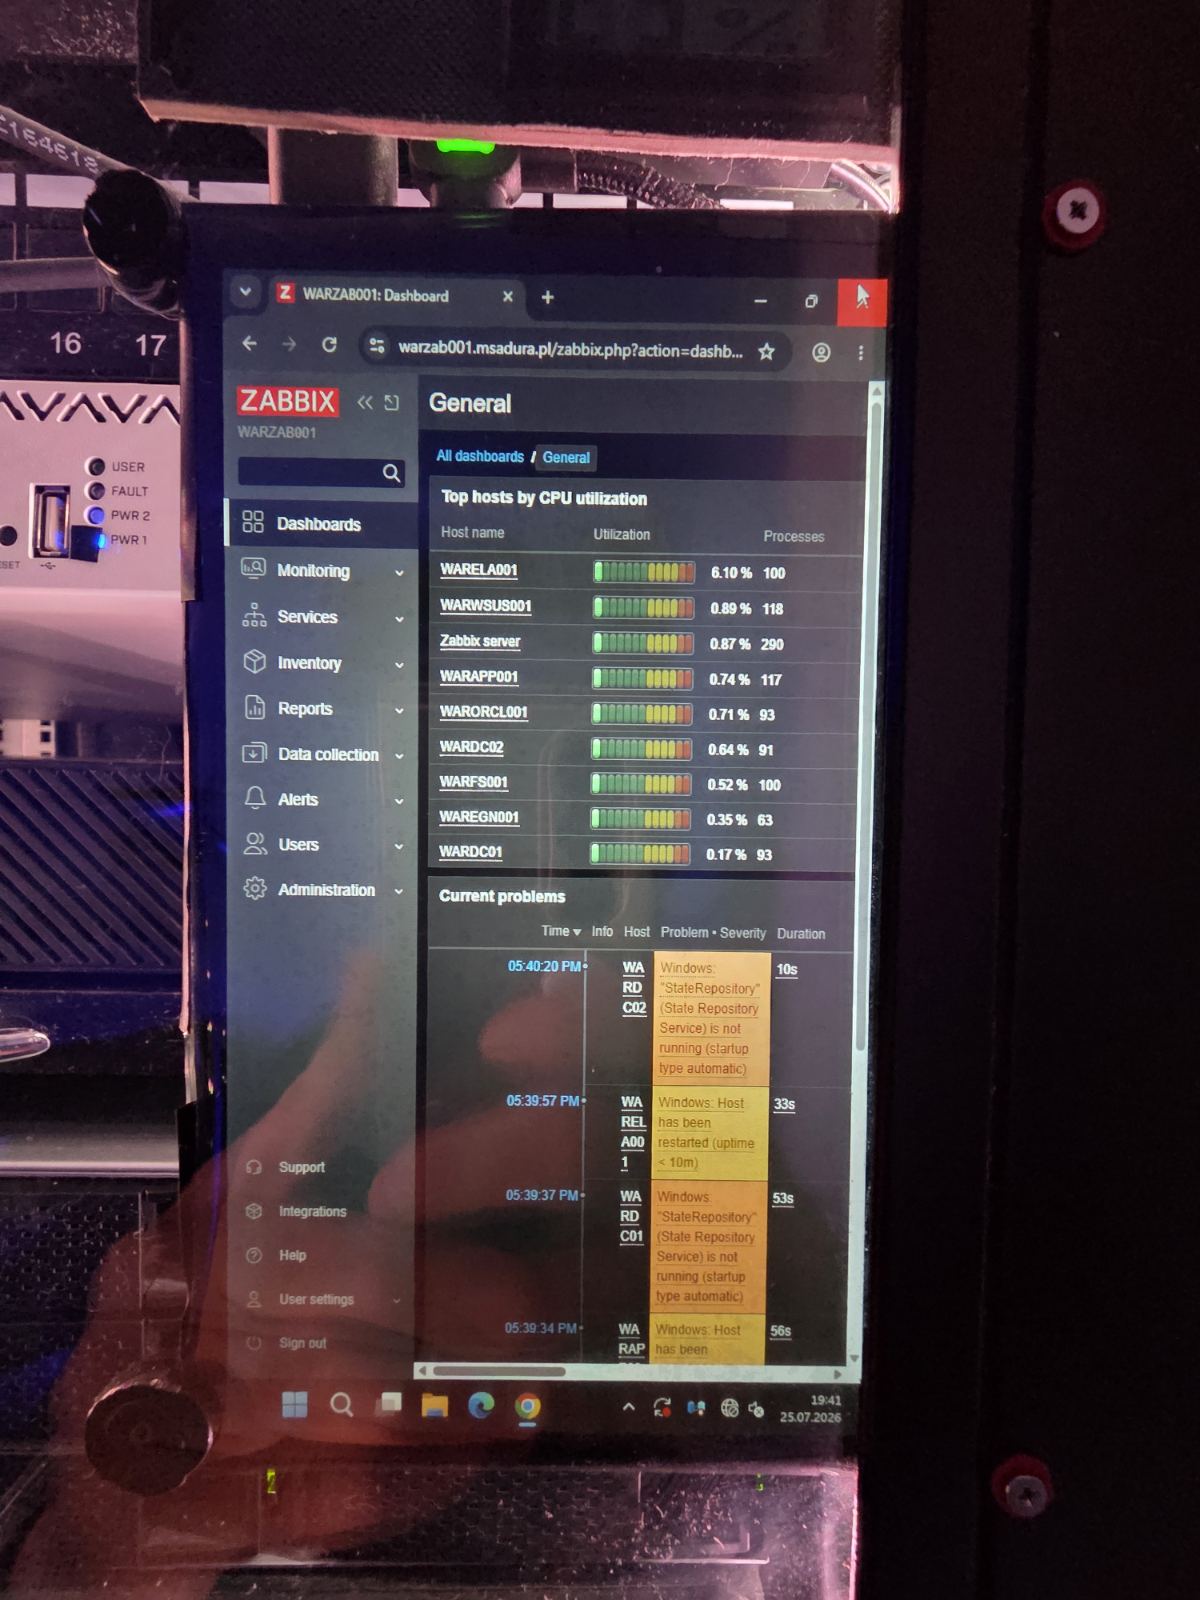
The most time-consuming part of this entire project wasn’t the hardware—it was Zabbix itself. Configuring a custom Zabbix dashboard to display the most critical triggers, graphs, and host statuses clearly on a tiny 1024×600 vertical canvas took some trial and error, but the result is incredibly satisfying.
Summary
I have to admit, this inconspicuous little display does an absolutely fantastic job. Whether I consciously mean to or not, I find myself glancing at Zabbix every time I walk past the rack. It has already allowed me to catch and react to a few minor warnings before they escalated into actual problems.
The only flaw I found with the Waveshare display is the lack of native brightness control. Out of the box, it is a bit too bright for a dark room. However, I easily solved this by applying a piece of tinted glass/film over the display, dimming it to the perfect level.
If you have a homelab, I highly recommend setting up a dedicated „NOC” screen. It changes the way you manage your infrastructure!