 Every homelab eventually reaches a critical mass. You move from running a few isolated virtual machines to managing a complex web of hypervisors, network hardware, and storage arrays. At that point, guessing what is happening under the hood is no longer an option. You need complete, centralized visibility.
In my environment, that role is fulfilled by Zabbix. It serves as the central nervous system of my infrastructure, aggregating metrics, logs, and statuses into a single pane of glass. Here is a look at how my monitoring stack is configured, the hurdles I overcame, and why you should consider running it in your own rack.
The Monitored Stack: Connecting the Dots
The goal from day one was absolute coverage. Currently, Zabbix is tracking every virtual machine in the cluster, pulling traffic metrics from my MikroTik switches, and keeping a close eye on storage health and power stability by querying my NAS and UPS natively via SNMPv3.
However, getting everything talking was not without its challenges. The absolute toughest nut to crack was integrating the FortiGate firewall. After multiple failed attempts and battling with standard SNMP polling limitations, I finally found the breakthrough: utilizing the „FortiGate by HTTP” template. Switching to the API-based HTTP approach instantly provided the granular performance and security metrics I had been looking for without the overhead of traditional polling.
Enterprise Access Control: Domain Logins and Custom Dashboards
A monitoring system is only useful if the right people can see the right data securely. To mirror an enterprise environment, Zabbix is fully integrated with Active Directory for seamless domain login.
Access is strictly strictly segmented by roles. Administrative users have full read/write access to tweak triggers and deploy new hosts, while „Guest” accounts are locked down to read-only permissions. This is perfect for safely sharing infrastructure health without risking accidental configuration changes. Furthermore, the UI experience is highly customized—each user is greeted with personalized dashboards highlighting only the metrics that matter most to their specific role.
 Bringing Data to the Physical World: The Rack Display
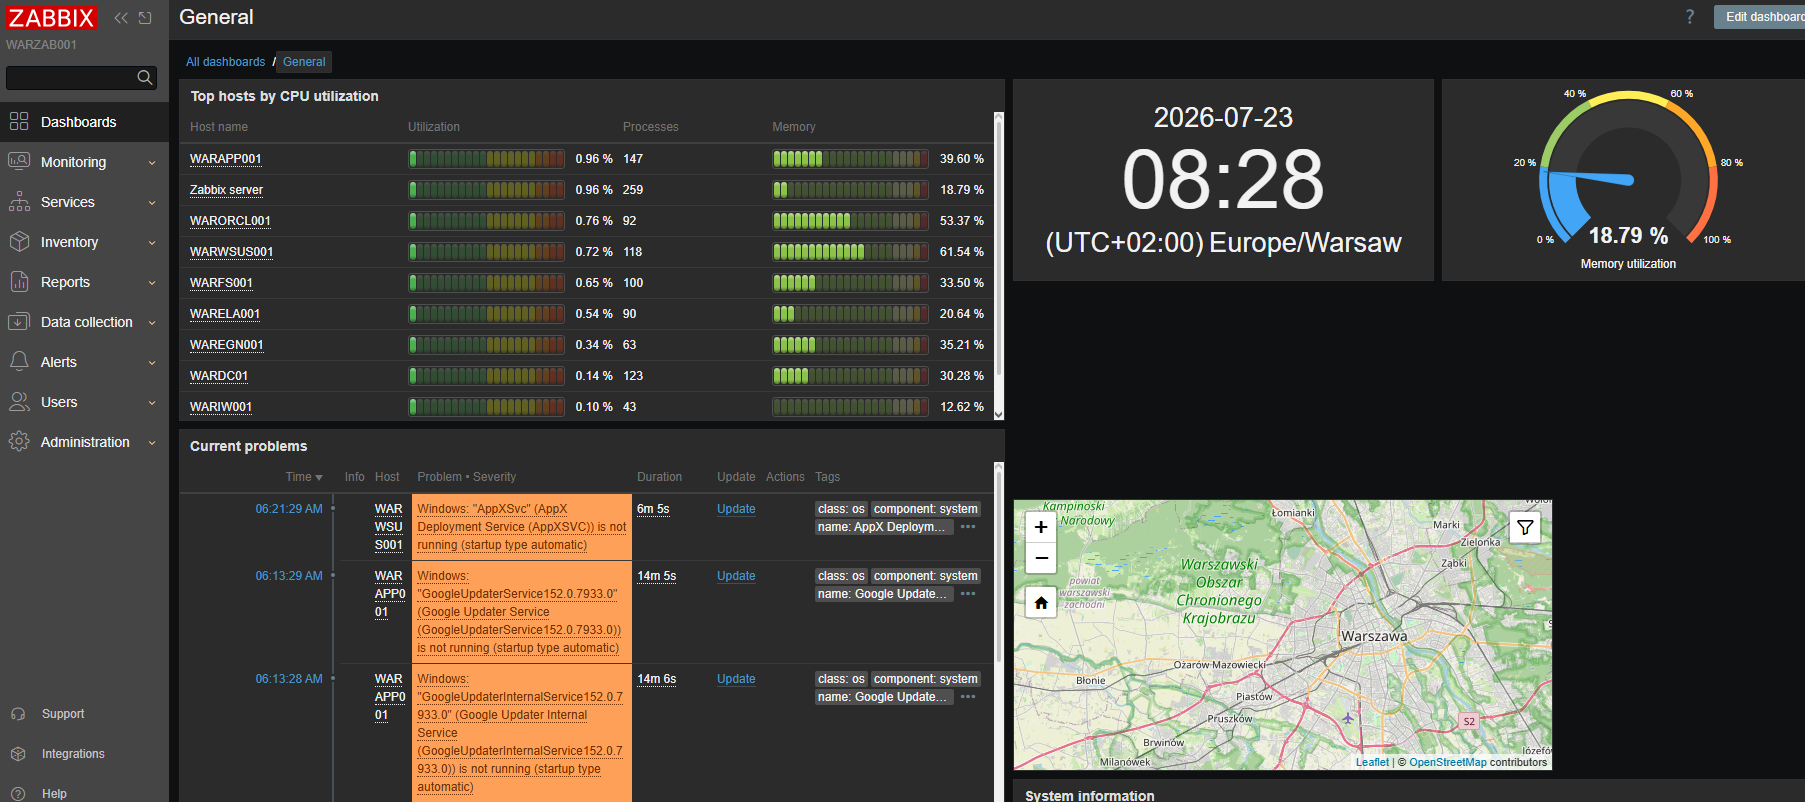
While web interfaces are great, I wanted something more tangible. I recently built and mounted a dedicated mini-display directly onto the glass door of my server rack. It runs a continuous loop of critical Zabbix dashboards, meaning I can check the core health of my entire network just by walking past the cabinet.
I will be publishing a dedicated, step-by-step build log on how I created this rack-mounted display in an upcoming article, so stay tuned for the hardware details!
Why Run Zabbix in a Homelab?
If you are on the fence about deploying a heavy-duty monitoring solution, here is why Zabbix is worth the effort:
-
-
Proactive Issue Resolution: Catching high disk utilization or memory leaks before they cause an actual outage.
-
Capacity Planning: Historical data takes the guesswork out of hardware upgrades. You know exactly when you need more RAM or a faster switch.
-
Single Pane of Glass: No more logging into five different web interfaces just to check if the network is healthy.
-
Enterprise Skill Building: Zabbix is an industry standard. Mastering its templates, triggers, and user management translates directly to real-world IT engineering skills.
-
The Roadmap: What is Next for the Monitoring Stack?
A homelab is never truly „finished,” and I have some exciting upgrades planned for the monitoring stack in the near future.
1. Grafana Integration on Docker Swarm In the immediate future, I will be pairing Zabbix with Grafana. While Zabbix is incredible at data collection and alerting, Grafana is the king of data visualization. I plan to deploy Grafana as a highly available containerized application on my Docker Swarm cluster, using Zabbix exclusively as the backend data source. I will post an update soon detailing how that deployment goes.
2. Instant Alerting via Telegram or Discord Right now, the dashboards are great, but I want the infrastructure to reach out to me when something breaks. My next project will involve configuring Zabbix webhooks to send instant push notifications to a Telegram bot or a private Discord channel—especially for critical hardware events like the UPS switching to battery power or a FortiGate WAN failover.
3. Automated Remediation Finally, I plan to leverage Zabbix’s „Action” capabilities to move from simply reporting issues to fixing them. By triggering remote SSH scripts, Zabbix will be able to automatically restart stalled Docker containers or clear temporary caches if disk space crosses a 95% threshold, completely hands-free.